Melbourne BOM Radar – Live Loops and Interpretation Guide
The Bureau of Meteorology operates a sophisticated weather monitoring station at Laverton, approximately 20 kilometres southwest of Melbourne’s central business district. This facility houses a Doppler-capable Meteor 1500 S-band radar that serves as the primary source for live precipitation tracking across the metropolitan area and surrounding regions.
Upgraded to dual polarization technology in 2017, the installation generates new images every six to ten minutes, offering critical data for severe weather assessment and daily rainfall monitoring. Understanding how to access and interpret this feed provides essential context for anyone tracking storm movements or planning outdoor activities across Victoria.
Where to Find and View the Live Melbourne BOM Radar
The Melbourne radar operates from a fixed installation at Laverton, positioned at 37°51′18.8″S 144°45′19.5″E. This location provides strategic coverage of the greater metropolitan area while minimizing terrain-induced beam blockage. The Bureau of Meteorology publishes live data through its official website, where users can access the 128 km looping animation updated continuously throughout the day.
| Live Status Current availability via official channels |
Coverage 128 km default, 200 km optimal range |
Update Every 6-10 minutes |
Key Feature 30-minute animated loops |
Key operational characteristics include:
- Fixed coordinates at Laverton (37°51′18.8″S 144°45′19.5″E) with full Doppler capability
- Dual polarization upgrade completed in 2017 according to technical records
- New image generation every 6-10 minutes throughout 24-hour operation
- Compositing of the lowest four sweeps to minimize ground clutter and terrain blockage
- Nyquist velocity limit of 90 km/h for precipitation movement tracking
- Supplementary coverage from Broadmeadows and Bairnsdale installations when required
- No public archive of historical radar loops currently maintained
| Feature | Specification |
|---|---|
| Location | Laverton (37°51′18.8″S 144°45′19.5″E) |
| Radar Type | Meteor 1500 S-band Doppler |
| Polarization | Dual (upgraded 2017) |
| Default Range | 128 km |
| Optimal Range | 5-200 km |
| Update Interval | 6-10 minutes |
| Loop Duration | 30 minutes |
| Antenna Rotation | Every 20 seconds |
| Sweeps per Cycle | 14 elevation levels |
| Nearby Sites | Broadmeadows, Bairnsdale |
How to Read and Interpret the Melbourne BOM Radar
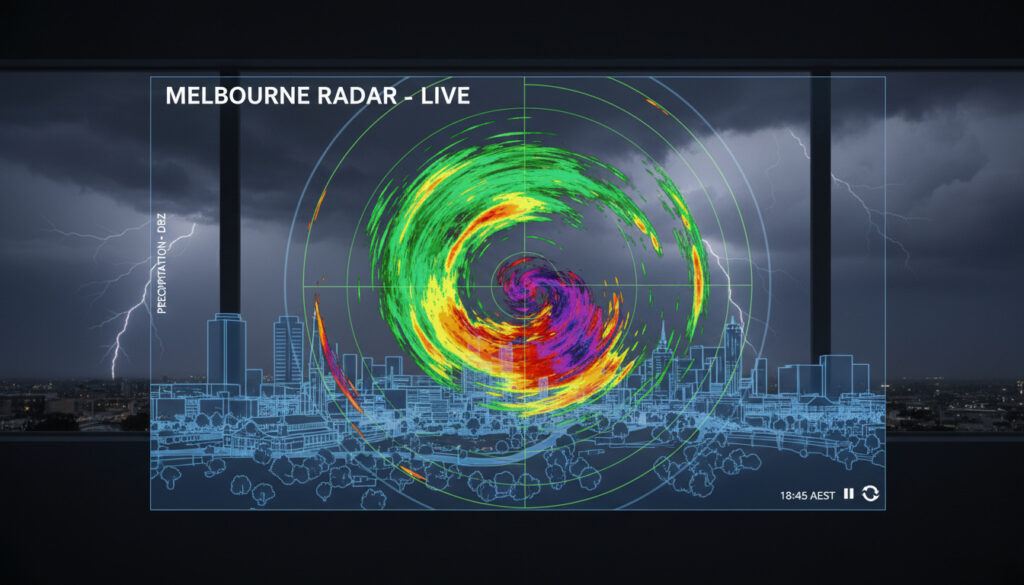
The Bureau of Meteorology states that colors represent rain reflectivity intensity measured in dBZ (decibels of reflectivity), indicating precipitation strength based on reflected signals from drop size, number, and ice or hail presence.
Decoding the Color Scale
According to the Bureau’s radar viewer guide, black indicates the heaviest precipitation or hail, corresponding to the highest dBZ values. The scale also indicates rain rate in millimetres per hour. Lighter colors signify weaker echoes and lighter rainfall, though hail and ice crystals may appear intense despite low surface rain rates.
Understanding Doppler Velocity
As a Doppler radar, the Laverton installation measures precipitation velocity with a Nyquist limit of 90 km/h. Dark red pixels indicate movement away from the radar; dark blue shows movement toward it. When these extremes appear adjacent, they may indicate rotation characteristic of severe weather systems. Velocities exceeding the Nyquist limit alias—for example, 100 km/h away displays as 80 km/h toward.
Black areas indicate the heaviest rain or possible hail, representing the highest dBZ values. However, intense colors do not always correlate with heavy surface rainfall—hail and ice aloft can produce strong reflectivity even when ground precipitation remains light.
Melbourne BOM Radar Loop, Updates, and Range
The technical operation follows specifications outlined in Bureau documentation. The system generates new images every 6-10 minutes, forming a continuous 30-minute loop for public viewing.
Update Cycles and Animation
According to the Bureau’s technical explanation, the antenna rotates every 20 seconds, performing 14 sweeps at increasing elevations. Images visible to the public composite data from the lowest four sweeps, prioritizing precipitation at lower altitudes while reducing ground clutter.
Coverage Boundaries
While the optimal operational range extends from 5 km to 200 km, the public interface defaults to a 128 km view for detailed now-casting. Beyond 200 km, the radar beam widens and elevates significantly—reaching approximately 3 km altitude at 200 km distance—potentially missing low-level precipitation. The system collects no data directly above the site due to overhead scanning limitations.
Beyond 200 kilometres, echoes weaken as the beam elevates and widens. At 200 km distance, the beam sits approximately 3 km above ground level, potentially missing significant low-level rain that may still reach the surface.
The standard interface displays a 30-minute animated loop updated every 6-10 minutes. This provides sufficient temporal resolution to track storm movement and intensity changes across the Melbourne metropolitan area.
Troubleshooting Melbourne BOM Radar Issues
Users occasionally report missing data or display irregularities. These situations typically stem from technical constraints rather than system failure.
Common Technical Limitations
Weak distant echoes or apparent gaps in coverage usually result from the radar’s elevation constraints or beam blockage from terrain features. Temporary outages also occur during scheduled maintenance or system upgrades. The Bureau does not maintain a public-facing downtime log for the Melbourne-specific installation, though network-wide upgrades since 2017 have improved overall reliability.
Alternative Coverage Options
When the Laverton radar experiences technical difficulties, meteorologists rely on supplementary Doppler installations at Broadmeadows (37°41′23.5″S 144°56′50″E) and Bairnsdale (37°53′15.1″S 147°34′31.8″E). Both sites operate Wurrung 2502C C-band systems with Doppler capability and rainfall accumulation tracking. Additional technical documentation is available through the Radar and Equipment Knowledge Centre.
How Has the Melbourne BOM Radar Changed Over Time?
- Initial Deployment: Installation of the Meteor 1500 S-band Doppler unit at Laverton, establishing primary coverage for the metropolitan region.
- 2017 Upgrade: Conversion to dual polarization technology, enhancing precipitation classification and data accuracy.
- Current Operation: Implementation of 14-sweep scanning cycles with 20-second rotation intervals, compositing the lowest four elevations for public display.
What Do We Know for Certain About the Melbourne BOM Radar?
| Established Information | Remaining Uncertainties |
|---|---|
| Fixed location at Laverton (37°51′18.8″S 144°45′19.5″E) | Specific maintenance schedules not publicly detailed |
| Dual polarization capability since 2017 | Real-time outage notification protocols |
| Update intervals of 6-10 minutes | Long-term archive access methods |
| Default 128 km range, optimal to 200 km | User-reported delay verification processes |
| No public historical loop archive available | Future upgrade timelines |
Why Does Melbourne Need This Radar Network?
The Laverton installation forms a critical node in Victoria’s severe weather warning infrastructure. Its Doppler capability enables the detection of wind patterns and storm rotation essential for identifying supercell development and tracking precipitation movement across a region prone to rapid weather changes. For detailed technical background, refer to the How radar works guide.
The dual polarization upgrade specifically improves the differentiation between rain, hail, and ice crystals, providing meteorologists with more accurate precipitation classification for flood forecasting and storm warning dissemination.
What Do Official Sources Say About Melbourne’s Weather Radar?
The Melbourne Bureau of Meteorology radar detects precipitation movement for wind and severe weather assessment, utilizing composites from the lowest four sweeps to minimize ground clutter and beam blockage.
Bureau of Meteorology Technical Documentation
Colors represent rain reflectivity intensity in dBZ, indicating precipitation strength based on reflected signal from drop size, number, and ice or hail presence. Black indicates the heaviest rain or hail.
Bureau of Meteorology Radar Guide
How Can You Access and Use the Melbourne BOM Radar Effectively?
Access the live 128 km loop through the Bureau’s official channels, where reflectivity colors and Doppler velocity data display current precipitation intensity and movement. Cross-reference these observations with the Weather Radars explanation guide to interpret dBZ values correctly. Consult alternative sites at Broadmeadows or Bairnsdale during Laverton maintenance periods.
Frequently Asked Questions
Where exactly is the Melbourne BOM radar located?
The radar operates from Laverton, positioned at 37°51′18.8″S 144°45′19.5″E, approximately 20 kilometres southwest of Melbourne’s CBD.
How often does the radar update?
New images generate every 6-10 minutes, with the antenna rotating every 20 seconds to complete 14 elevation sweeps.
What do the black areas on the radar mean?
Black indicates the heaviest precipitation or hail, representing the highest dBZ (reflectivity) values on the scale.
Why can’t I see rain beyond 200 km?
Beyond 200 kilometres, the radar beam elevates to approximately 3 km altitude, potentially missing low-level precipitation as the beam widens and weakens.
Is there a way to view historical radar images?
The Bureau of Meteorology does not provide public access to archived historical loops; only current live and 30-minute looping data is available.
What should I do if the radar appears offline?
Check the Bureau’s official website for network status, or consult alternative Doppler radars at Broadmeadows or Bairnsdale for coverage of the Melbourne area.
How do I read the Doppler velocity colors?
Dark red indicates precipitation moving away from the radar; dark blue indicates movement toward it. Adjacent extremes may signal storm rotation.
More related posts
 Ing Home Insurance – Coverage Costs and Claims Guide
 Protest Melbourne Today: Locations, Times & Live Updates
 Carlton Game Today – No AFL Fixture April 15, Next vs Collingwood
 Top Golf Gold Coast – 2025 Rankings and Best Courses
 Sesame Street Characters – Main Muppets, Voices and History
 Bitcoin Price US – Latest Data, History and Forecasts
 How to Write a Mission and Vision Statement: Steps & Examples
 Chemist Warehouse Toowoomba: Hours, Location, Phone & Products